|
G
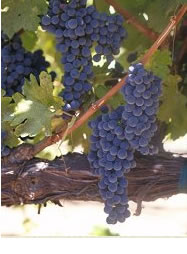
rowing of the grape requires careful consideration of the microclimate
of the selected location. Growing conditions are determined
largely by the solar radiation received at the site. The sun
is the primary energy source for practically all biological
processes on the earth. Solar radiation has a direct affect
on the air and soil temperature, transpiration, soil moisture
and atmospheric humidity, etc.
The amount of solar
radiation received at a site varies widely with slope and
aspect of the area. Particularly in hilly and mountainous
areas. The total growing season solar radiation can be measured
in Mega Joules per square meter received through the period of
April first to October 31th. The accumulated seasonal solar radiation
tends to be lower on slopes facing north, north east and north
west and higher for the slopes facing south.
Figure (3).
Table of solar radiation variation with respect to Slope and
Aspect of the Okanagan valley (1987).
|
Slopes
|
Aspects
|
| N |
NE |
E |
SE |
S |
SW |
W |
NW |
| 10 |
3570 |
3624 |
3818 |
4025 |
4132 |
4089 |
3907 |
3689 |
| 20 |
3162 |
3282 |
3687 |
4082 |
4273 |
4202 |
3856 |
3406 |
| 30 |
2689 |
2900 |
3520 |
4064 |
4314 |
4233 |
3755 |
3047 |
| 40 |
2200 |
2520 |
3328 |
3965 |
4259 |
4174 |
3609 |
2729 |
| 50 |
1716 |
2183 |
3109 |
3799 |
4103 |
4037 |
3421 |
2406 |
The weather data
archive for the state of California is available online from
the university of California's web site. Unfortunately the
number of stations with sensors for detecting solar radiation
in this region is limited to 3 stations and the website
does not provide any information about the slope and aspect
of these stations. So, to generate a table like the table
in Figure 3, since the state of California and the province
of British Columbia are approximately at the same geographical
longitude I used the the variability of the solar radiation
with changes in the slope in Okanagan valley (Figure 3) as
reference and interpolated a solar radiation table
for Napa County based on that.
To interpolate I found the average seasonal solar radiation
for the slopes of less than 10 degrees in Summerland - Okanagan.
This average is the same as the average seasonal solar radiation
for flat areas in Okanagan. From that I computed the percentage
difference in the value observed in each field of the table in
Figure 3 and the Average Seasonal solar radiation of the flat
areas in Okanagan. The calculated values are summerized in Figure 4.
Figure (4).
The percentage of variation between the average seasonal solar
radiation of flat areas and the values in table of Figure 3.
Average of Seasonal
Solar Radiation of Summerland in flat areas = 3856.75
|
Slopes
|
Aspects
|
| N |
NE |
E |
SE |
S |
SW |
W |
NW |
| 10 |
-0.0743 |
-0.0603 |
-0.0100 |
0.04360 |
0.07136 |
0.06020 |
0.0130 |
-0.0434 |
| 20 |
-0.1801 |
-0.1490 |
-0.0440 |
0.05840 |
0.10792 |
0.08951 |
-0.0001 |
-0.1168 |
| 30 |
-0.3027 |
-0.248 |
-0.0873 |
0.05373 |
0.11855 |
0.09755 |
-0.0263 |
-0.2099 |
| 40 |
-0.4295 |
-0.3466 |
-0.1370 |
0.02806 |
0.10429 |
0.08225 |
-0.0642 |
-0.2924 |
| 50 |
-0.5550 |
-0.4339 |
-0.1938 |
-0.0149 |
0.06384 |
0.04673 |
-0.1129 |
-0.3763 |
Finally I calculated the expected seasonal solar radiation
for Napa County using the table in Figure 4 and the average
seasonal solar radiation for years between 1995 to 2002 for
Napa-C station (1)
which is located at the heart of the Napa valley and is known
to be at a flat area (no aspect).
Figure (5).
The expected values of the solar radiation in the Napa county
with changes to Slope and aspect of the area.
|
Slopes
|
Aspects
|
| N |
NE |
E |
SE |
S |
SW |
W |
NW |
| 10 |
4430.16 |
4497.17 |
4737.91 |
4994.79 |
5127.57 |
5074.21 |
4848.36 |
4577.83 |
| 20 |
3923.86 |
4072.77 |
4575.35 |
5065.52 |
5302.54 |
5214.43 |
4785.07 |
4226.65 |
| 30 |
3336.89 |
3598.73 |
4368.11 |
5043.19 |
5353.42 |
5252.90 |
4659.73 |
3781.15 |
| 40 |
2730.07 |
3127.17 |
4129.85 |
4920.33 |
5285.17 |
5179.69 |
4478.56 |
3386.53 |
| 50 |
2129.46 |
2708.97 |
3858.09 |
4714.34 |
5091.58 |
5009.68 |
4245.26 |
2985.70 |
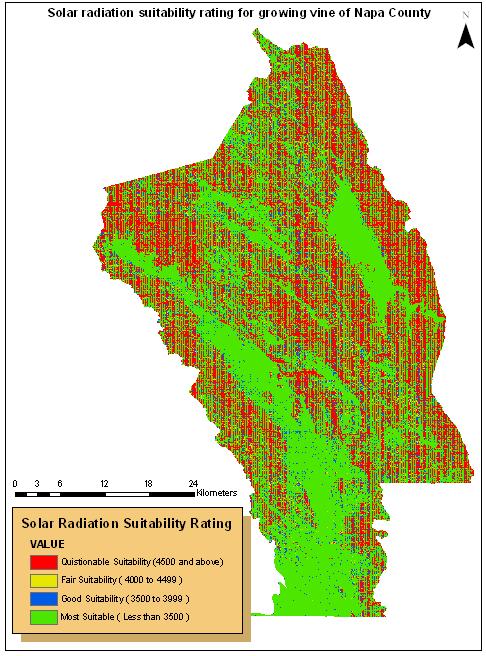
To map the table
in Figure 5, I first generated the slopes of the Napa using
the 3m DEM of the county and the 3D Analyst extension of the
ArcGIS. Then I used the reclassify command of the spatial analyst
of the ArcGIS to classify the slopes (0-10,10,20,20-30,30-40,40-50,50-90).
I applied the same procedure again but this time to compute
the aspect map.
Using the the raster
calculator of the spatial analysis extension of the ArcGIS
I generated a map from slopes and aspect layer that satisfied
the conditions in Figure 6.
Figure (6).
Solar radiation suitability classes
Class
|
Solar Radiation (MJ)
|
Ranking
|
1
|
4500 and above |
most suitable |
2 |
4000 to 4499 |
good suitability |
3 |
3500 to 3999 |
fair suitability |
4 |
less than 3500 |
questionable suitability |
This classification
is based on the classification used to generate the Atlas
of Suitable Grape Growing Regions of Okanagan Valley (1987).
Click
here to see the final map
Growing Degree Suitability, Soil Drainage Suitability,
Final Results
|

